
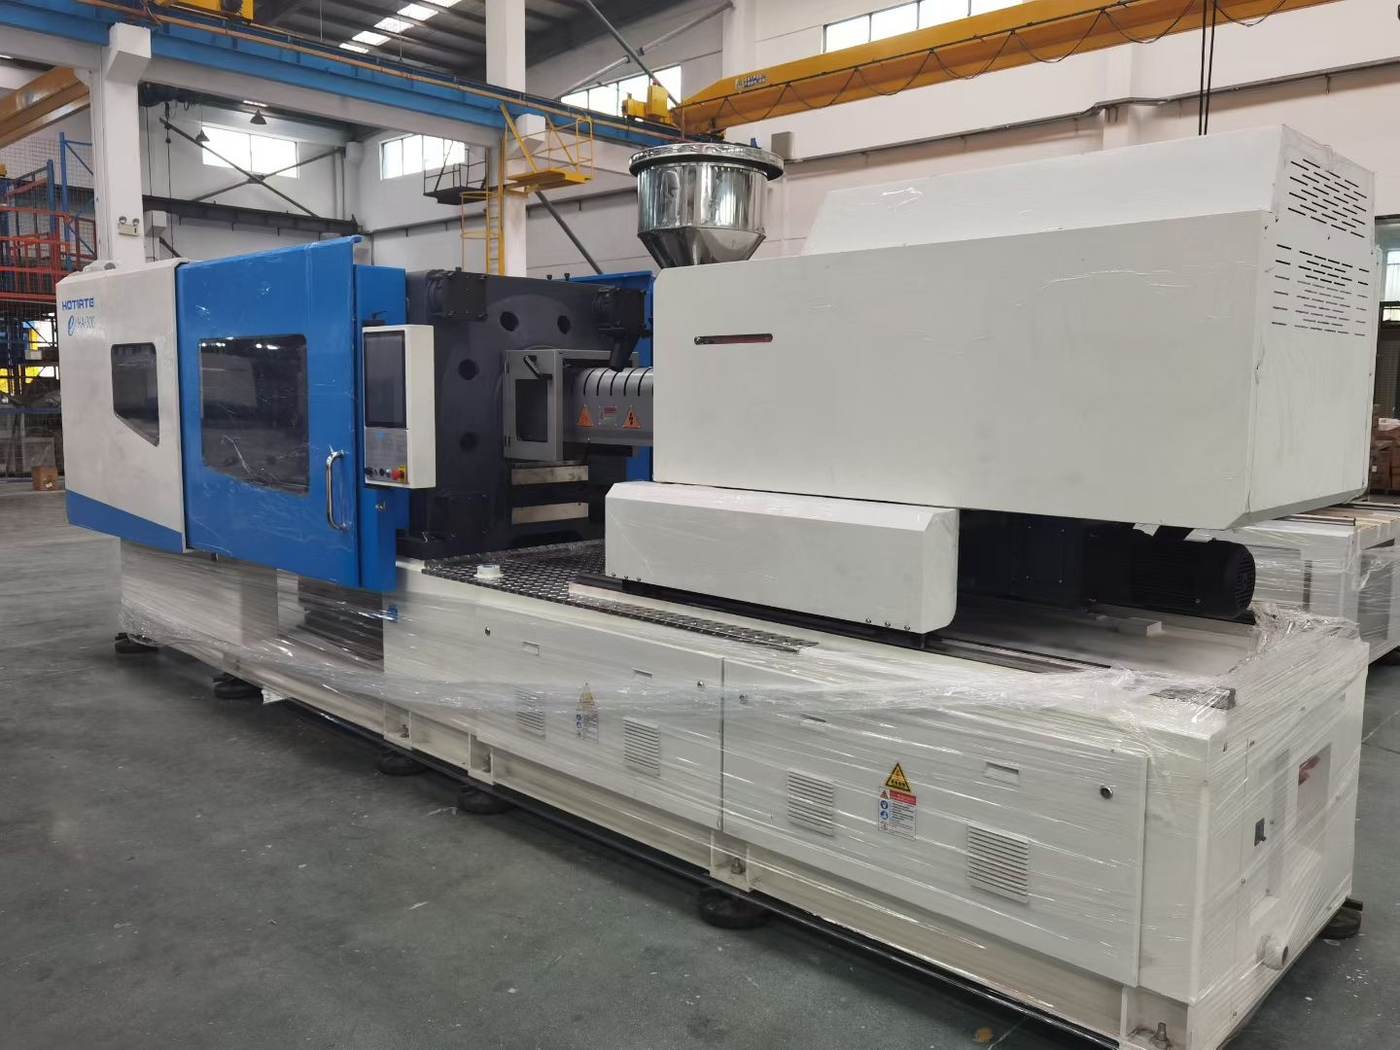
How do I compare GEERPOWER all-electric and hydraulic machines with real project ownership in mind?
Use a total-cost model with five blocks: machine and installation, energy and utility, maintenance, downtime exposure, and trial/commissioning burden. This is more reliable than comparing machine list price alone.
Decision checklist
- Set the same annual output and cycle assumptions before comparing model families.
- Standardize utility cost, electricity tariff and operating shift profile in the cost sheet.
- Separate maintenance and service assumptions between machine and auxiliaries.
- Include commissioning window, trial sample cost, and expected learning curve in final decision.
- Keep a risk allowance for utility mismatch and local installation constraints.
Start from output, not from machine list price
For both routes, unit price is only one variable. A project-level comparison must first align output target, material mix, mold complexity, and process stability requirement.
A price-only comparison often causes hidden overruns later because installation, maintenance, trial and support scope diverge by route.
If route comparisons use different output or duty assumptions, they are not comparable even when both posts as 'new machine'.
Five-block cost model
Build a model across five blocks and use the same assumptions for both routes.
- Capex and installation (machine, utilities, tooling fit, factory adaptation)
- Energy cost (kWh/kilogram target and duty cycle basis)
- Service and preventive maintenance costs by route
- Downtime probability and replacement/safety stock allowance
- Trial, training, commissioning and early optimization support
Where all-electric tends to differ
In many projects, all-electric systems can reduce certain energy and control tuning burdens when process variability is moderate and shift continuity is stable.
Hydraulic systems may remain advantageous in some heavy-tonnage or legacy integration contexts where route familiarity and maintenance supply lines are already established.
The route decision should be made on evidence and context, not ideology.
How to avoid wrong winner selection
Count total cost over the first 12 to 18 months, including project launch costs and the first acceptance cycle, not just machine unit cost.
If a lower price wins while utility, trial and acceptance assumptions remain unverified, it is likely a hidden-loss decision.
Technical limitation and project boundary
This framework is route-level guidance only. Actual machine lifecycle results depend on exact model, mold profile, resin family, utility quality and team competence.
Specific cycle time, power draw, uptime or payback figures must use validated project data from the same machine configuration.
Common buyer questions
Which route is usually cheaper for small production runs?
Not a fixed rule. Small runs reduce absolute energy spread. Evaluate installation and setup complexity first, then compare all cost blocks on the same production assumption.
Can I use this model without full utility measurements?
You can use a provisional model, but every unresolved utility value must remain marked as pending with a confidence range.
Does all-electric always mean lower energy cost?
No. Energy profile varies by process window, resin, machine family and utilization. Compare measured baselines only after a project-aligned pilot or comparable benchmark.
Sources and references used for this guide
This guide supports early project planning. Final machine selection and commercial configuration must be confirmed from the actual part, mold, material, factory utilities and production target.

